
General Real Estate · NW Metro Atlanta
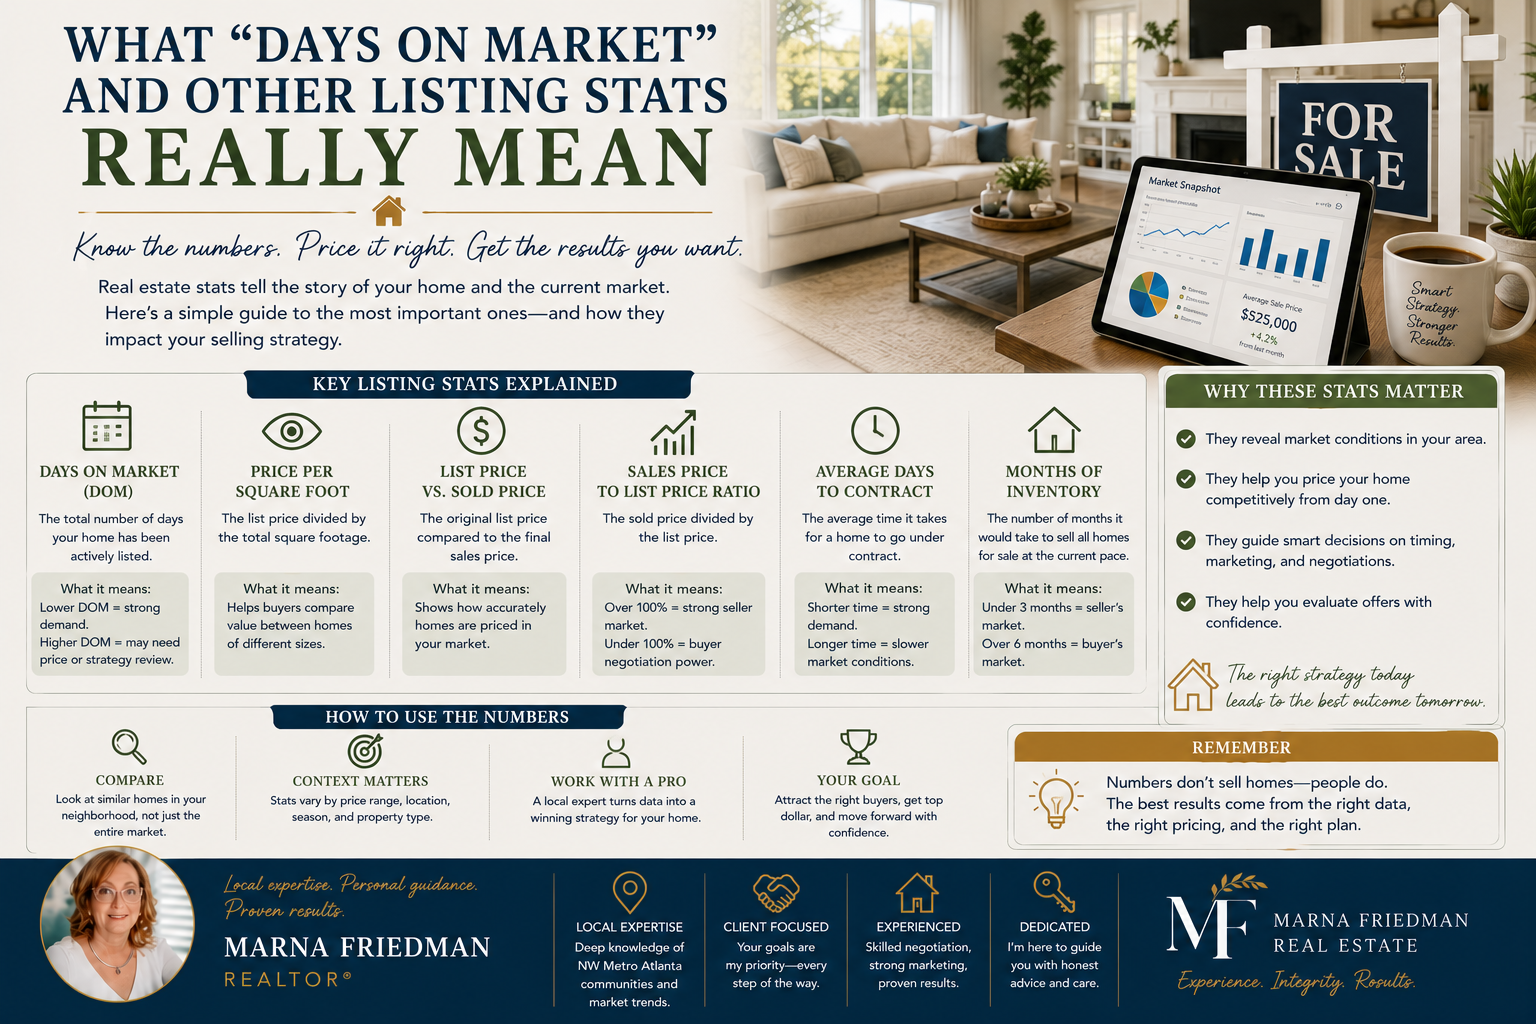
Days on market measures how long a listing has been active, and it is the most quoted and most misread number in real estate. Read correctly, it is a price-and-demand signal: a home sitting well past its market's typical pace is usually telling you something about its price, condition, or presentation, while a fresh listing tells you to move at the market's speed. Read alongside its companion statistics, list-to-sale ratio, months of supply, and the pattern of price changes, it becomes a genuinely useful instrument for both sides of a transaction.
Buyers and sellers quote these numbers at me weekly, sometimes as leverage, sometimes as worry, and the numbers deserve better than either. Here is what each statistic actually measures, the quirks that distort them, and how to use them the way professionals do: as context for a decision, never as the decision itself.
Key Takeaways
- Days on market only means something relative to the typical pace for that area, price range, and property type; the same number is stale in one segment and normal in another.
- Counting rules vary: relistings, status changes, and portal displays can reset or extend the visible number, so verify the true marketing history before drawing conclusions.
- List-to-sale ratio reveals negotiating reality better than anecdotes: how close to asking homes actually close.
- Months of supply is the market's thermometer, indicating whether conditions currently favor sellers, buyers, or neither.
- Price reductions are information about the original price, not proof of a defect; the pattern and size of cuts tell the story.
"The same thirty days means different things near the Marietta Square and out in Ball Ground. I never let clients react to the number until we have pulled the full listing history behind it."
Marna Friedman, REALTOR®, Atlanta Communities
What does days on market actually measure, and what distorts it?
At its simplest, days on market counts from the listing's active date to contract or to today. The distortions come from how listings live in the systems that count them. A home withdrawn and relisted may show a young number with an old history; MLS rules on when the count resets vary and change, and public portals sometimes display their own counts that differ from the MLS's. Cumulative days on market, the version that survives relistings, exists precisely because the simple number can be refreshed. Status changes muddy it further: a listing that went under contract, fell through, and returned carries a different story than one that sat untouched, and the fell-through reason, financing, inspection, buyer circumstances, matters enormously to what the number means.
So the professional habit is simple: never react to the displayed number without the history behind it. Your agent can pull the full listing record, every status change, price change, and prior listing, and that two-minute pull converts a bare statistic into an actual narrative. A home showing 90 days that spent 30 of them under a contract that failed on the buyer's financing is not the same 90 days as a home the market has simply declined for three months.
How should buyers use these numbers?
As pacing and leverage instruments, in that order. Pacing first: in a segment where well-priced homes go under contract inside a couple of weeks, a listing in its first days deserves your promptness and a clean, competitive offer, the preparation logic of pre-approval exists exactly for this moment. Leverage second: a listing well past its segment's pace has usually had its asking price answered by silence, which can open room on price, terms, or both. The history tells you which conversation to have; a long-sitting home with one modest cut invites a different offer than one that has stair-stepped down repeatedly.
Two cautions keep buyers honest with the data. Long market time is not automatically a defect signal, homes sit for reasons as mundane as an ambitious original price, poor photos, or a launch into a holiday lull, and the inspection process, not the day count, is what evaluates condition, per how inspections work. And a fresh listing is not automatically fairly priced; new merely means untested. In both directions, the number starts the analysis rather than finishing it.
What do the companion statistics tell you?
| Statistic | What it measures | How to read it |
|---|---|---|
| Days on market | A listing's time exposed to the market | Only against the segment's typical pace, with full history |
| List-to-sale ratio | Closed price as a share of asking | Near or above full price signals competition; wider gaps signal room |
| Months of supply | How long current inventory would take to sell at the current sales pace | Lower favors sellers, higher favors buyers; watch the trend |
| Price change history | The seller's adjustments over the listing's life | Size and cadence of cuts reveal strategy and motivation |
| Pending and closed activity | What is actually selling right now nearby | The freshest read on demand, ahead of closed-sale statistics |
The statistics work as a set. Months of supply tells you the weather; list-to-sale ratio tells you how negotiations are actually ending in that weather; days on market places one home against that backdrop; and the price history explains how the seller has responded so far. Any one alone can mislead; together they describe a market accurately enough to act on.
How should sellers read the same numbers?
Before listing, they set expectations: your segment's typical market time is the honest forecast for a well-priced launch, and the prevailing list-to-sale ratio is the honest forecast for negotiation, both better guides than a neighbor's story. After listing, your own accumulating days become the market's verdict on your price, and the discipline is deciding in advance what the checkpoints mean: strong traffic and offers inside the segment's pace confirm the strategy, while quiet weeks are data calling for a response, in presentation, access, or price, made deliberately rather than defensively, the framework from how to price your home.
Sellers should also respect what the number does in buyers' heads. Every buyer sees the day count next to your photos, and past a segment's normal pace it begins asking a question on your behalf: what does the market know? One meaningful, well-timed adjustment answers that question far better than a series of small trailing cuts that document reluctance, and relaunching with corrected price and refreshed presentation, where the history warrants it, is a legitimate strategy your agent can weigh against your MLS's rules. The goal is never to game the count; it is to stop the count from narrating against you.
Where do these numbers come from, and which sources should you trust?
The MLS is the source of record: agent-entered, rule-governed, and the basis for the statistics professionals quote. Public portals republish MLS data with their own display choices and their own calculated fields, which is why the same home can show different counts on different sites, and why portal-estimated values are a separate conversation entirely from the appraisal process I covered in the appraisal explained. Market-level statistics, median prices, supply, pace, are published by MLSs and REALTOR® associations on regular cycles, and they describe segments, not your street; the numbers that support an actual price decision come from a current comparable analysis of homes like the one in question, which is what a real market analysis is for.
The healthy relationship with all of it: let the statistics brief you, then let the specific evidence decide. Markets are made of individual homes, and every number in this article exists to help you see one home more clearly, not to replace looking.
Frequently Asked Questions
What is a good number of days on market?
There is no universal number; it depends on the area, price range, and property type. The useful question is how a listing compares to the current typical pace for homes like it, which your agent can pull precisely.
Does high days on market mean something is wrong with the house?
Not necessarily. Ambitious original pricing, weak presentation, or poor launch timing sit homes as often as condition does. The listing history suggests the reason; the inspection evaluates the home.
Why do different websites show different days on market?
Portals apply their own display rules to MLS data, and relistings or status changes can reset some counts and not others. The MLS record, with cumulative history, is the version to trust.
What is list-to-sale ratio?
The closed sale price as a percentage of the asking price, aggregated across recent sales. It shows how negotiations are actually ending in a segment, which is more useful than anecdotes about lowballing or bidding wars.
What does months of supply mean?
How long the current inventory would take to sell at the current pace of sales. Lower figures indicate conditions favoring sellers, higher figures favor buyers, and the direction of change matters as much as the level.
Should sellers relist to reset days on market?
Relisting rules belong to your MLS, and cumulative history remains visible to agents regardless. The better move is fixing what the market rejected, price or presentation, and letting a genuine relaunch stand on the correction.
Numbers make better advisors than masters, and these particular numbers reward anyone who learns their accents. If you want the real statistics for your segment, or the full history behind a listing you are watching anywhere in NW Metro Atlanta, reach out, and my buyer and seller resources carry the rest of the toolkit.
Marna Friedman is a REALTOR® with Atlanta Communities serving NW Metro Atlanta. Statistical definitions and MLS rules vary and change; figures describe markets generally and are not a substitute for a current analysis of a specific property. Information is deemed reliable but not guaranteed. Equal Housing Opportunity.
Check out this article next